


The naturalization process confers U.S. citizenship upon foreign citizens or nationals who have fulfilled the requirements established by Congress in the Immigration and Nationality Act (INA). After naturalization, foreign-born citizens enjoy nearly all of the same benefits, rights, and responsibilities that the Constitution gives to native-born U.S. citizens, including the right to vote.
According to the U.S. Department of Homeland Security, 757 434 persons naturalized during 2012.
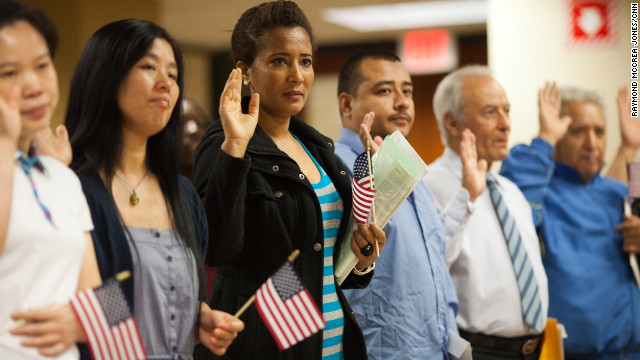
 The Naturalization Process
An applicant for naturalization must fulfill certain requirements set forth in the INA concerning age, lawful admission and residence in the United States. These general naturalization provisions specify that a foreign national must be at least 18 years of age; be a U.S. legal permanent resident (LPR); and have resided in the country continuously for at least five years. Additional requirements include the ability to speak, read, and write the English language; knowledge of the U.S. government and history; and good moral character.
Special provisions of naturalization law exempt certain applicants from some of these general requirements. The primary types of applicants who may, under certain conditions, be eligible for specific exemptions include spouses and minor children of U.S. citizens and persons with qualifying military service in the Armed Forces of the United States.
Every applicant for naturalization who is 18 years of age or older must file an N-400 Application for Naturalization. All applicants who meet the preliminary documentary requirements must be interviewed by officers from U.S. Citizenship and Immigration Services (USCIS) to determine their eligibility to naturalize. In most cases, the officer verifies the applicant’s knowledge and under standing of English and the history and government of the United States. Qualified applicants are then scheduled for an oath ceremony before a judge or before an officer with authority delegated by the Secretary of Homeland Security.

Trends and Characteristics of Persons Naturalizing
The number of U.S. naturalizations increased to 757,434 in 2012 from 694,193 in 2011 and 619,913 in 2010. These increases were consistent with the growing number of naturalization applications filed and processed during 2010–2012.
Historical Trend
The average annual number of persons naturalizing increased from less than 120,000 during the 1950s and 1960s to 210,000 during the 1980s, 500,000 during the 1990s, and to 680,000 between 2000 and 2009. Until the 1970s, the majority of persons naturalizing were born in European countries. The regional origin of new citizens shifted from Europe to Asia due to increased legal immigration from Asian countries, the arrival of Indochinese refugees in the 1970s, and the historically higher naturalization rate of Asian immigrants. Consequently, Asia has been the leading region of origin of new citizens in most years since 1976.
Region and Leading Countries of Birth
Thirty-five percent of persons naturalizing in 2012 were born in North America, followed by 34 percent from Asia and 11 percent from Europe. Mexico was the leading country of birth of persons naturalizing in 2012 (14 percent). The next leading countries of origin of new citizens in 2012 were the Philippines (5.9 percent), India (5.7 percent), the Dominican Republic (4.4 percent), and the People’s Republic of China (4.2 percent). The 10 countries with the largest number of naturalizations accounted for 49 percent of all new citizens in 2012.
From 2011 to 2012, the number of naturalizations increased the most for immigrants from North America. Among leading countries of origin, the largest increase in naturalizations during this period—in absolute and percentage terms—occurred among persons born in the Dominican Republic (12,843 or 63 percent) and Cuba (10,173 or 48 percent). In addition, the number of naturalizations of immigrants born in India and the People’s Republic of China decreased for two consecutive years from 2010 to 2012 partly due to a decline in the number of naturalizations of persons from these countries who were granted LPR status under employment-based preference categories.
Years in Immigrant Status
Persons naturalizing in 2012 spent a median of seven years in LPR status before becoming citizens (see Table 7). Immigrants born in Africa spent the least time in legal immigrant status (5 years), followed by immigrants from Asia and South America (6 years), Europe (7 years), Oceania (8 years), and North America (10 years). The median years spent in LPR status for all persons naturalizing increased by one year from 2011 to 2012.
For more information about immigration and immigration statistics, visit the U.S. Department of Homeland Security web page at http://www.dhs.gov.